衛星大地測量作業四
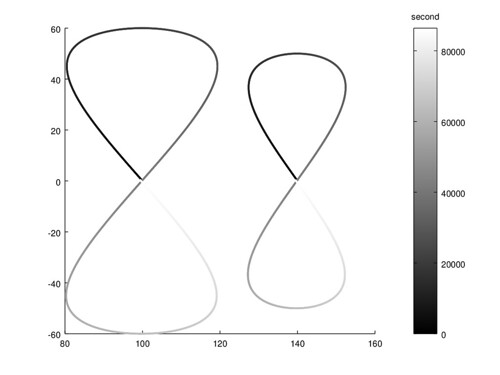
用線性化的公式假設軌道為圓計算衛星軌道投影在地面的軌跡。
根據黃金維老師講義中單元二附錄 C 的計算流程:
C20 = 108263E-8;
GM = 397778481800000;
earth_rotation_speed = 7.292115147*10^-5;


if (!exist('a'))
  a = input('major-axis of satellite orbit (m): ');
end

if (!exist('i') || iscomplex(i))
  i = input('inclination angle of satellite orbit (rad): ');
end

if (!exist('lon0'))
  lon0 = input('longitude when satellite cross equator (rad): ');
end

mean_earth_radius = 6371000;
ae = mean_earth_radius;
we = earth_rotation_speed;
n = @(a) GM^0.5/a^1.5;

perigee_argument_speed = @(e, a, i) (
                            3*n(a)*C20*ae^2 /
                            (4*(1-e^2)^2*a^2) *
                            (1 - 5*cos(i)^2)
                          );

ascending_node_speed = @(e, a, i) (
                          3*n(a)*C20*ae^2 /
                          (2*(1-e^2)^2*a^2) *
                          cos(i)
                        );

mean_anomaly_speed = @(e, a, i) (
                        n(a) - 3*n(a)*C20*ae^2 /
                            (4*(1-e^2)^1.5*a^2) *
                            (3*cos(i)^2-1)
                      );

function plot_xy_gradiant_color(x, y, color)
  surface([x' x'], [y' y'], [color' color'],
          'LineWidth', 2,
          'EdgeColor', 'flat');
end

function plot_xy_time(x, y, time)
  plot_xy_gradiant_color(x, y, time);
  hx = colorbar();
  title(hx, 'second');
end


u_dot = perigee_argument_speed(0, a, i) + mean_anomaly_speed(0, a, i);
ome_dot = ascending_node_speed(0, a, i);

sample_count = 360;
time_tic = longitude = latitude = zeros(1, sample_count);
count = 1;

lt = longitude;
wt = longitude;
for t = 0:60:86400
  u = mod(t*u_dot, pi*2);
  time_tic(count) = t;
  lat = asin(sin(i)*sin(u));
  if (i<=pi/2)
    latitude(count) = lat;
  else
    latitude(count) = -lat;
  end

  if (i<pi/2)
    sign = 1;
  else
    sign = -1;
  end

  lambda_t = sign*atan(abs(cos(i)) * tan(u));
  lt(count) = lambda_t;
  wt(count) = t*(we-ome_dot);
  if (u > pi/2 && u < pi/2*3)
    lambda_t += pi;
  end

  lon = lon0 + lambda_t - t*(we-ome_dot);
  if (lon > pi*2 || lon < 0)
    lon = mod(lon, pi*2);
  end
  longitude(count) = lon;
  count+=1;
end

plot_xy_time(longitude*180/pi, latitude*180/pi, time_tic);
if (exist('output_image'))
  print('-dpng', output_image);
end
其中單位是用公尺、公斤、弧度, 做圖時再轉換回角度。