影像處理作業二:邊緣與直線偵測
影像處理作業二,以指定的程式語言,實作數種邊緣偵測。 另外要選一種直線偵測或 watershed segmentation 演算法。 其中邊緣偵測我嘗試了 sobel 與 prewitt 二種矩陣, 而直線偵測我實作了 hough transform,但結果不是很好。
程式
和 作業一 一樣使用 pythun3。 因為用到一些矩陣乘法,雖然還是用 pil , 但讀進來後就直接把整張影片轉成 numpy array 了; 當然事後存檔時也就要再轉回 pil 的格式,再存回 bmp。
程式的參數寫法比作業一好看一點了,只要串連二個演算法, 就能把上一個結果丟到下一個演算法中處理, 而輸入和輸出是寫在第一個和最後一個參數。 寫起來像是這樣:
# input -> sobel -> threshold -> hough -> output
python3 prog2.py p1im4.bmp \
    gradient sobel \
    threshold 0.96 \
    hough \
    p1im4_hough.bmp
如果要串接上一次的程式,只能直接各執行一次,透過檔案傳遞:
python3 prog1.py mean 3 p1im4.bmp p1im4_mean.bmp
python3 prog2.py p1im4_mean.bmp \
    gradient sobel \
    threshold 0.96 \
    hough \
    p1im4_mean_hough.bmp
參數
- gradient: sobel 或 prewitt,對應二種不同矩陣。
- threshold: 0-1 數字,以百分位數作門檻二值化。
- hough: 無參數。
- LoG: 無參數。
差分邊緣偵測
邊緣偵測作法是將一個 pixel 與前後的 pixel 強度相減, 若該 pixel 處於交界處,相減後的差異就會很大。 將影片看成矩陣的話,相減差分的算式也可以用矩陣來表示, 也就是摺積的概念。 我試了 sobel 與 prewitt 二種矩陣,矩陣如下:
sobel = \begin{bmatrix}
    -1 & -2 & -1 \\
     0 &  0 &  0 \\
     1 &  2 &  1
\end{bmatrix}
prewitt = \begin{bmatrix}
    -1 & -1 & -1 \\
     0 &  0 &  0 \\
     1 &  1 &  1
\end{bmatrix}
相減是單一方向的操作,但影像是二維的, 所以一般做法是在垂直和水平方向上都做一次差分。 二方向上的差分可以取絕對值後相加, 或是計算歐幾里德長度。
對於彩色影像,通常是分別計算 rgb 三個波段的差分, 再將三個波段的結果組合。 一樣可以用絕對值相加,或是歐氏長度。 我都是用歐氏長度。
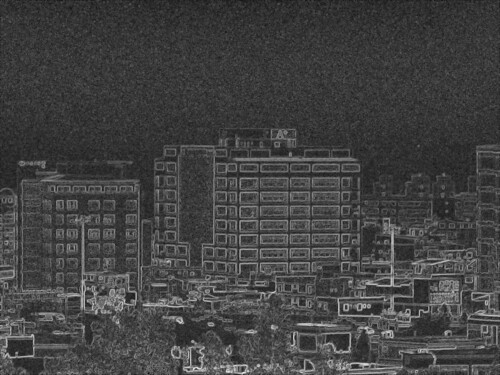
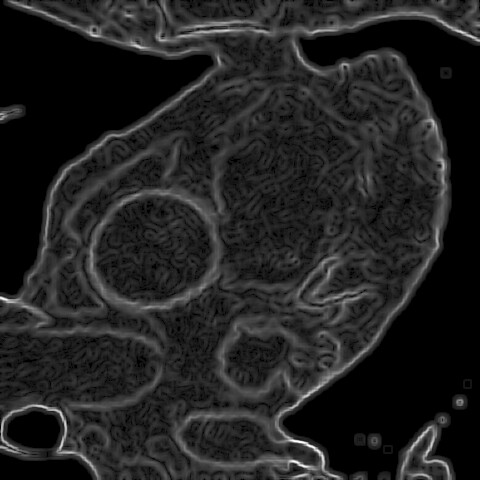
差分成果
由於 sobel 的系數較大,在值的分布上,sobel 會較 prewitt 大。 但二者的結果,都會超過原有影像的亮度區間, 如果將二者都正規化為 0-1 或 0-255 的話, 那其實沒有很明顯的差別。
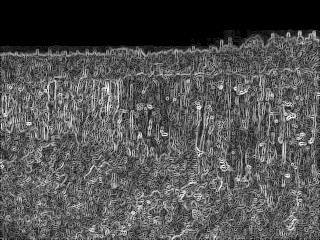
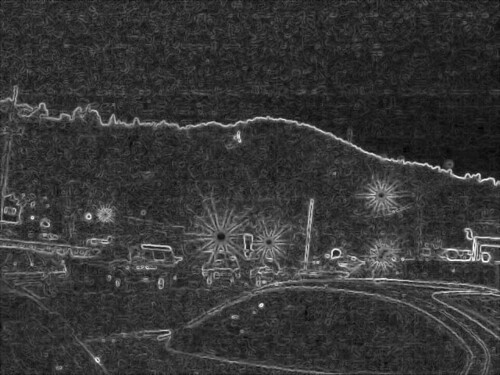
此處展示所有 sobel 的差分影像, 其中所有影像都是用上次作業處理過的版本再去差分, 而非原始影像。
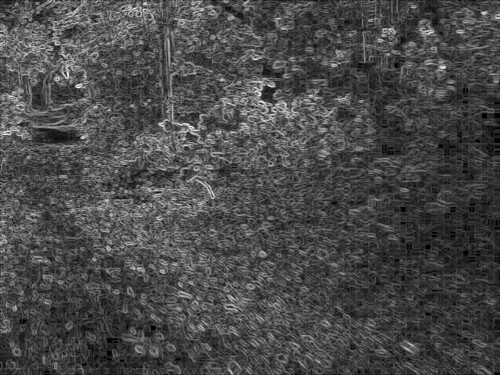
濾鏡
一些影像我在處理時,使用像 gamma 或直方圖均化時, 或是使用影像銳化時,會把原本的雜訊放大; 就會造成差分後的影像雜訊也變重。
反之,如果使用了模糊的濾鏡,也就會減少差分後的雜訊。 而 mean filter 又比 median filter 的效果要好, 因 mean filter 只是讓整體的變化變平緩, 但 median filter 會讓整體的色塊趨近一致,導致邊界變形, 不同色塊的邊界差距也不會縮小,邊界的區域也就不會擴張。


二值化
二值化我是以百分位數做統計後挑出門檻, 沒有想出較好的判斷法。 不是很喜歡這種需要每張影像調整不同參數的做法, 但全自動又很困難。
有時也很難定義哪些是雜訊,有些影像會有很多樹葉邊界, 都市的照片除了建築邊界,也有很多雜物的邊界; 且那些細小的邊界的強度還不一定比建築物的邊界低。

laplacian of gaussian
這個實作普通,但如同上課講的,效果不是很好;
除非要使用 zero crossing 或判斷邊界方向之類的進階操作。
我嘗試直接用 threshold = 0 判斷 zero crossing,
但結果沒有很好,會把大片什麼都沒有的區域也都判成 zero crossing。


hough
最後是第二題,我挑選了 hough transform 實作, 本來以為是最簡單,結果在把找出的直線還原回原始圖片上花了很多時間。 而且結果的品質一直沒有很好,除非是很簡單的圖像, 不然都會出現一堆雜訊導致的錯誤直線。
hough transform 的最大特色, 是為了消除線條垂直時斜率無限大的問題, 所以以 cos 和 sin 當作方程式中 x y 的系數。 所以在轉換的目標域中避免了無限大的問題。 但我在將目標域中求出的直線參數, 對應回原始影像中的直線時,一開始直覺以每個 x 值找出對應的 y 值, 就又撞回 0 或無限大的問題,當 y 值的系數為 0 時即無法求解。
後來一直想不到比較好的解法,就參考了 opencv 教學中的作法 。
opencv 教學中,是直接選出位在圖像中的一點,
並取一個極大的數,求出相對於圖像中一點的 x 距離為該數的 y,
再將極大數取負號即可得出另外一點。
最後只要將二點間連線即可,因為以計算來說,
參數式的計算是較固定的,這部份我就實現了一個類似於 cv2.line 的函數。
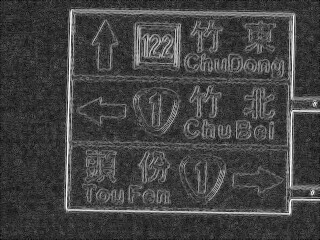
hough transform 結果
結果很差,只有在圖像很簡單時,偵測結果比較明顯。 最好的成果大概是道路號誌牌的四條邊界, 在結果看得出來是對應的四條線。 作法就是用上一次作業的影像 4, 經過 mean filter、sobel、threshold、hough 得到結果。
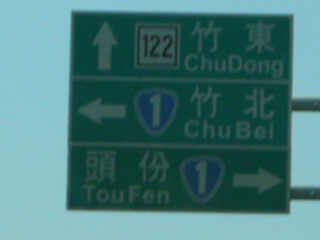
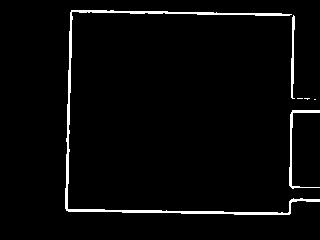
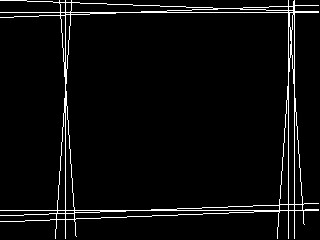
但我將 hough 轉回原始影像的程式只用 threshold, 沒有辦法很好的找出唯一那個點, 所以周圍的幾個點也都會抓進來,讓一條直線分身成好幾條。 且實作的畫線程式也沒有很好,有時線還不到影像邊界就結束。
調參數的介面
寫函數是簡單的,處理人機介面才是最麻煩的地方。 影像處理中,很多地方要調整參數, 如果沒有全自動,就只能一個個嘗試, 這時候程式的介面就很重要了。 而對人友善和介面乾淨又是完全不同的二件事, 雖然不見得互斥,但絕對不會介面拆的乾淨, 需要互動使用時就用的舒服。
程式原始碼
import sys
# import prog1 # reuse some code from previous homework
import numpy
import PIL.Image

def numpy_image_open(path):
    pil_image = PIL.Image.open(path)
    numpy_image = numpy.array(pil_image)
    return numpy_image

def numpy_image_save(image, path):
    pil_image = PIL.Image.fromarray(image.astype('uint8'))
    pil_image.save(path)

def numpy_image_to_gray(image):
    matrix = numpy.matrix([1,1,1])
    return image * numpy.transpose(matrix / 3)

def numpy_matrix_3x3(text):
    return numpy.array(text.split()).astype(int).reshape((3,3))
def numpy_matrix_nxn(n, text):
    return numpy.array(text.split()).astype(int).reshape((n,n))

def convolute_image(image, f, radius=1):
    radius = int(radius)
    pad_spec = ((radius, radius), (radius, radius))
    pad_image = numpy.pad(image, pad_spec, mode='reflect')
    copy = numpy.ndarray(image.shape)
    for x in range(0, image.shape[1]):
        for y in range(0, image.shape[0]):
            (pad_x, pad_y) = (x+radius, y+radius)
            area = pad_image[
                pad_y-radius:pad_y+radius+1,
                pad_x-radius:pad_x+radius+1
            ]
            copy[y,x] = numpy.sum(f(area, (y,x), image))
    return copy

def gradient_image(image, image_filter):
    radius = (image_filter.shape[0] - 1) / 2
    def gradient(area, index, image):
        return area * image_filter
    vertical = convolute_image(image, gradient, radius)

    image_filter = numpy.transpose(image_filter)
    horizontal = convolute_image(image, gradient, radius)

    return (vertical ** 2 + horizontal ** 2) ** 0.5


def gradient_image_color(image, image_filter):
    result = numpy.zeros(image.shape[0:2])
    for i in (0,1,2):
        result += gradient_image(image[:,:,i], image_filter) ** 2
    result = result ** 0.5
    return image_range_adjust_linear(result ** 0.5)

def laplacian_of_gaussian(image, radius=2, threshold=2):
    result = numpy.zeros(image.shape[0:2])
    for i in range(3):
        result += image[:,:,i]
    result /= 3

    matrix = image_filter['laplacian_of_gaussian']
    def f(area, index, image):
        return area * matrix
    radius = (matrix.shape[0] - 1) / 2
    result = convolute_image(result, f, radius)
    # return find_zero_cross(result, threshold)
    return image_range_adjust_linear(numpy.abs(result))

def find_zero_cross(image, threshold):
    return (numpy.abs(image) < threshold).astype(int) * pixel_max

def image_range_adjust_linear(image):
    max = numpy.max(image)
    min = numpy.min(image)
    range = max - min
    image = (image - min) / range * pixel_max
    return image

image_filter = {}
image_filter['sobel'] = numpy_matrix_3x3('''
    -1 -2 -1
     0  0  0
     1  2  1''')

image_filter['prewitt'] = numpy_matrix_3x3('''
    -1 -1 -1
     0  0  0
     1  1  1''')
image_filter['laplacian_of_gaussian'] = numpy_matrix_nxn(5, '''
0   0 -1  0  0
0  -1 -2 -1  0
-1 -2 16 -2 -1
0  -1 -2 -1  0
0   0 -1  0  0
''')

pixel_max = 255
def statistic_ratio_gate(image, ratio):
    histogram = numpy.zeros([pixel_max+1])
    def statistic(area, index, image):
        pixel = area[1,1]
        if pixel > 255:
            pixel = 255
        histogram[int(pixel)] += 1
    convolute_image(image, statistic)

    total_pixel = image.shape[0] * image.shape[1]
    gate_pixel_number = int(total_pixel * ratio)

    below_pixel_count = 0
    for gate in range(0, 256):
        if below_pixel_count >= gate_pixel_number:
            return gate - 1
        else:
            below_pixel_count += histogram[gate]
    return pixel_max

def threshold_ratio(image, ratio):
    # gate = ratio * pixel_max
    gate = statistic_ratio_gate(image, ratio)
    def threshold(area, index, image):
        if area[1,1] >= gate:
            return pixel_max
        else:
            return 0
    return convolute_image(image, threshold)

# hough transform
def find_distance_at_angle(xy, angle):
    (x,y) = xy
    return y * numpy.cos(angle) + x * numpy.sin(angle)

def find_y_in_x(angle_distance, x):
    (angle, distance) = angle_distance
    return (x * numpy.sin(angle) - distance) / numpy.cos(angle)

def increase_count_in_struct(struct, p, weight=1):
    (angle, distance) = p
    struct[angle, distance] += weight

def make_hough_struct(image, resolution):
    (angle_resolution, distance_resolution) = resolution
    angle_number = int(numpy.pi / angle_resolution) + 1
    distance_max = (image.shape[0]**2 + image.shape[1]**2) ** 0.5
    distance_number = int(distance_max / distance_resolution) + 1
    return numpy.zeros([angle_number, distance_number])


def draw_line_in_image(image, p1, p2):
    vector = numpy.array(p2) - numpy.array(p1)
    length = numpy.sum(vector ** 2) ** 0.5
    unit_vector = vector / length
    draw_point = numpy.array(p1).astype(float)
    (height, width) = image.shape
    def draw(point):
        if (0 <= point[0] and point[0] < width-1 and
            0 <= point[1] and point[1] < height-1):
           image[int(point[1]), int(point[0])] = pixel_max
    for l in range(0, int(length)+1):
        draw(draw_point)
        draw_point += unit_vector

def hough_transform(image):
    distance_resolution = int(image.shape[0] / 40)
    angle_resolution = numpy.pi / (15 * 4)

    struct = make_hough_struct(image, (angle_resolution, distance_resolution))
    def increase_from_point(value, index, image):
        angle = 0
        (y, x) = index
        while angle < numpy.pi:
            distance = find_distance_at_angle((x,y), angle)
            distance_index = int(round(distance / distance_resolution))
            angle_index = round(angle / angle_resolution)
            increase_count_in_struct(struct, (angle_index, distance_index))
            angle += angle_resolution

    # image_gate = statistic_ratio_gate(image, threshold_ratio)
    for_point_in_image(image, image > 0, increase_from_point)

    copy = numpy.zeros(image.shape)
    # reverse angle dinstance to x y result infinity
    def draw_line_from_angle_distance(value, index, struct):
        (angle_index, distance_index) = index
        angle = angle_index * angle_resolution
        distance = distance_index * distance_resolution
        (height, width) = image.shape
        a = numpy.sin(angle)
        b = numpy.cos(angle)
        x0 = a*distance
        y0 = b*distance
        x1 = int(x0 + width*(-b))
        y1 = int(y0 + height*(a))
        x2 = int(x0 - width*(-b))
        y2 = int(y0 - height*(a))
        draw_line_in_image(copy, (x1,y1), (x2,y2))

    # edge_gate = statistic_ratio_gate(struct, threshold_ratio)
    edge_gate = numpy.max(struct) * 0.4
    for_point_in_image(struct, struct>=edge_gate, draw_line_from_angle_distance)
    return copy

# def find_cross_border(image, angle, distance):
#     (height, width) = image.shape
#     solve_x = lambda y: -(y*numpy.cos(angle)-distance) / numpy.sin(angle)
#     solve_y = lambda x: (distance-x*numpy.sin(angle)) / numpy.cos(angle)
#     in_range = lambda l,x,u: l <= x and x <= u
#     if in_range(0, solve_x(0), height):
#         return (0, solve_x(0))
#     elif in_range(0, solve_x(width-1), height):
#         return (width-1, solve_x(width-1))
#     elif in_range(0, solve_y(0), height):
#         return (width


def for_point_in_image(image, expression, f):
    iterator = numpy.nditer(expression, flags=['multi_index'])
    while not iterator.finished:
        if iterator[0]:
            f(image[iterator.multi_index], iterator.multi_index, image)
        iterator.iternext()

def main(argv):
    argv = argv[1:] # remove program name
    path_read = argv[0]
    image = numpy_image_open(path_read)
    argv = argv[1:]

    while len(argv) > 1:
        if argv[0] == 'gradient':
            matrix = image_filter[argv[1]]
            argv = argv[2:]
            gradient_image = gradient_image_color(image, matrix)
            image = gradient_image
        elif argv[0] == 'threshold':
            ratio = float(argv[1])
            argv = argv[2:]
            image = threshold_ratio(image, ratio)
        elif argv[0] == 'LoG':
            argv = argv[1:]
            image = laplacian_of_gaussian(image, 2)
        elif argv[0] == 'hough':
            argv = argv[1:]
            image = hough_transform(image)
        else:
            print('unknown parameter: ', argv, file=sys.stderr)
            exit(1)

    path_write = argv[0]
    numpy_image_save(image, path_write)

if (__name__ == '__main__'):
    main(sys.argv[:])